Week in Review
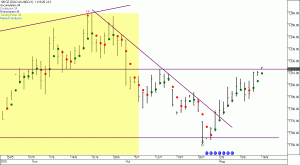
This week started out slow and steady, trading in a small range bound to the 5200 level. Wednesday had a close towards the low of its range and then things got a little crazy, closing at 4983 – a drop of nearly 4%.
Thursday and Friday saw the market drop 177 points driving the XJO chart through the rising trend line. At one point today the XJO was trading at 4954, but traded up in the last 90 minutes of the session.
From the chart right you can see that the market is approaching an intersection of 2 lines, a horizontal support line and a rising Fibonacci line, I would expect the XJO to pause and perhaps consolidate at this point. The chart should reach this zone quickly, perhaps Tuesday of next week. Continue reading “Week in Review”
Gold, A sparkle of hope.
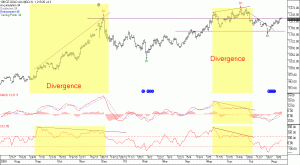
With uncertainty in equity markets around the world, one of the places smart money is rushing towards is Gold. Looking at the chart, over the past 18 months has shown us some great examples of “Divergence”. Where we can see charts continuing to make higher peaks and troughs but momentum indicators like “MACD” and “CCI” show an opposite direction.
At this point in time gold is testing the resistance coming from the peak of December 09. Momentum indicators are showing strength and using the Market Conductor (below) we are seeing very positive signs of continued growth.
If you are in the market for the next area of growth, maybe the gold sectors are worth a look. Oh, and don’t tell your wife that gold is a great opportunity, or else you may find yourself on the way to the local Jewelery Store to fulfill her requests.

![MetaStock - [Chart2 - S&P AUST INDEX ASX 200 INDEX (Trade Price)]_2013-05-24_16-50-03](http://stevesoars.com/wp-content/uploads/2013/05/MetaStock-Chart2-SP-AUST-INDEX-ASX-200-INDEX-Trade-Price_2013-05-24_16-50-03-300x164.jpg)
