Oil — Supply / Demand / Storage

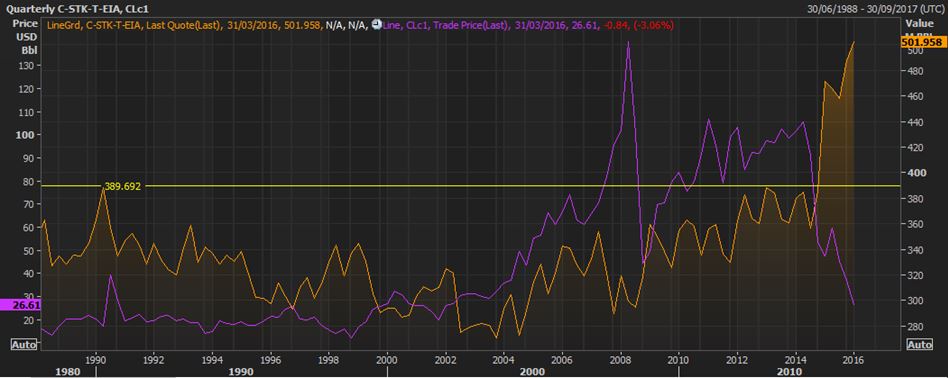
Oil as we all know has had dropped just under 75% over the last 7 quarters from $105 to $26usd per barrel, the issue is just oversupply and lower demand, pretty simple in economic terms. However this is creating another issue that’s about to get pretty interesting. If current production/usage rates continue, storage is about to become a pretty big issue with oil producers, which may force a critical turning point for the industry.

So the logical conclusion is that unless more storage is created around the globe for the surplus, producers will have to either cut production or to find additional storage which in the short term.

World Oil storage is sitting at around 96%. The large stores of oil currently would indicate 1 of 2 things – either; more storage facilities need to be created around the world to increase the current holdings of excess or the oil providing nations will need to engage tankers as a temporary overflow as they wait for a buyer. If the latter is the case then the very expensive floating storage costs will be borne by the supplier (rather than the purchaser which I assume is the case now). Now that is very black or white, but in reality they are the only choices.

I feel that the combination of oversupply, lower demand, the reduction in available storage, may be the critical point for the oil producers. Future production should lower in North America with the shale oil producers being squeezed out (or at least scaled back), though I’m not sure how much of a change in global supply that will create. One thing that’s pretty certain, is that there is too much oil, not enough buyers and a lack of additional storage.

2016-02-11 21_10_54-oil storage

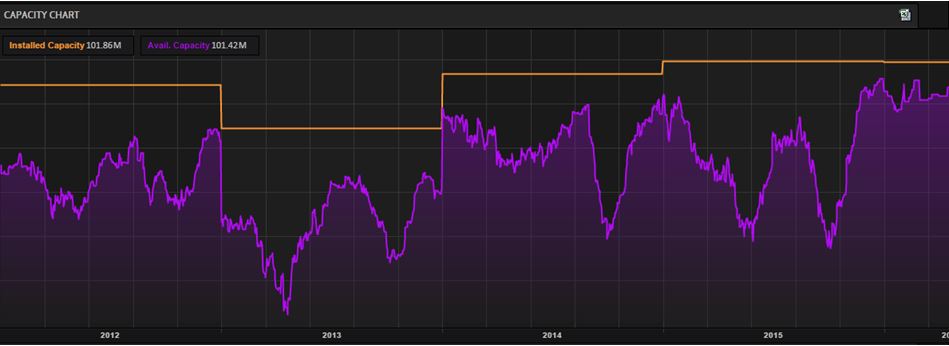
The chart above shows current holdings and storage capacity – currently they are running just under 96% capacity hence storage rates rising 10% since August, or 29% over the last 17 months. The chart below is the current storage costs in relation to the oil price. Considering the change in percentages in the last year between the commodity and the storage, this has got to be squeezing someone.

2016-02-11 21_12_03-oil storage costs

Looking at the forward futures charts from Thomson Reuters, based on known variables the TR computers have come up with the following forecast curves on oil prices over the next couple of years. This is fluid data and forecasts will change with given conditions. But any producer with a $40 barrel cost is in for a long period of pain, I’m not sure I could get long oil or gas with this data, until something changes. 2016-02-11 21_12_51-oil cost curve


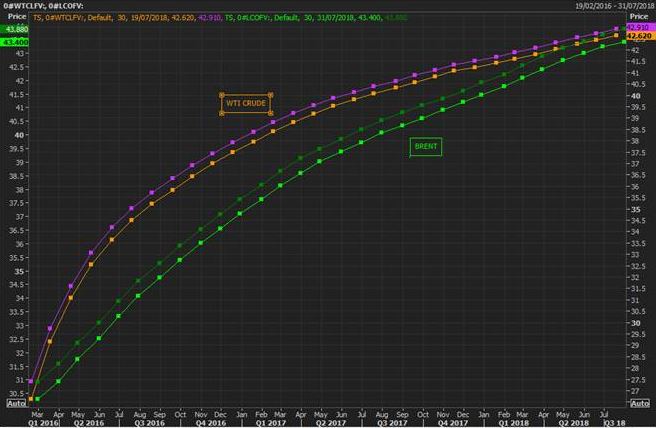
(Charts taken from Thompson Reuters Eikon 11Feb2016)

Happy investing

Investing for Total Return

Over the last few years there has been a significant move towards investing into yield. This may be because of the lower interest rate environment we are in or perhaps its just my clients moving closer (as a group) towards retirement. Either way, it is a large shift from the pre-gfc investment environments.

So as an investor is it better to look for high yielding or high growth opportunities or would it be better to look at total returns?

In March 2009, which in hindsight was the bottom of the GFC. The ASX S&P200 (XJO) was trading at 3145. Currently it is trading at just under 5300 (this follows a recent fall from near 6000 in Mar15). Using a pure capital growth calculation it has regained an impressive 2155 points or provided an increase of 68% if you were lucky enough to have purchased at the bottom. Unfortunately if you bought at the top of the peak (6748 in 2007) you probably still have losses.xjo v xjoai

If you look at the same time frames on the Accumulation index XJOAI, which is the ASX S&P200 plus dividends reinvested. In March 2009 the XJOAI was 21298, its last price as 47385. This is a gain of 26087 or 122%.

The chart on the right shows a 10 year comparison between the 2 indices. The XJO after 6 years has failed to reach the highs of 2007, but the Accumulation index shows us a completely different result.

asx sectorThe companies listed on the ASX are predominantly made up of Banks (financials) and Miners (materials) combined they amass over 60%.

So for our market to rise in its current form we will need strength in these sectors. With current pricing in commodities we are unlikely to see another mining boom in the next few years, yet better value in commodities is more likely – and the banks are in a pattern of low growth. Considering these facts, unless the sector weight changes happen for our top index we may struggle to get back to the 6000 level where it found resistance earlier in 2015.

2015-11-18 16_38_19-Monitor 4

From the table above, you can see just a couple of stocks in the top 200. Both CBA and TLS have the highest yield but the overall return for 12 months is negative – Where the other 3, have a low or modest yield but the 1 year returns are very impressive.

So the moral to the story is, unless you are investing for pure yield (meaning you need the income to live off) you will always be better off trying to focus on total returns rather than just the dividend.

Diversify or Suffer the Consequences

In today’s global investment environment, equities, fixed interest or property from around the world is very accessible. bhp-rio
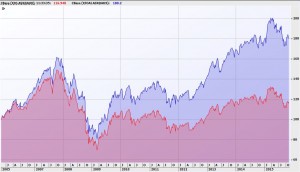
This means 2 things – some part of the world will always be performing better than another and any investment has a true diversified alternative.

bhp-anz
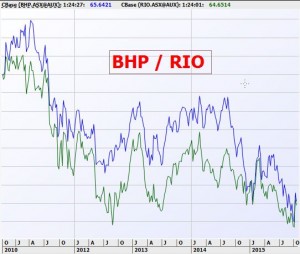
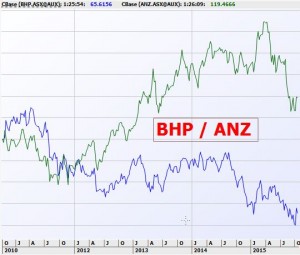
Diversification is measured by the correlated move of 2 investments – for example if BHP changes its value (up or down) there is a high probability that RIO will move in the same direction. So the 2 investments do not offer much diversification, they may vary a little but from the chart to the right similar issues will effect both companies.
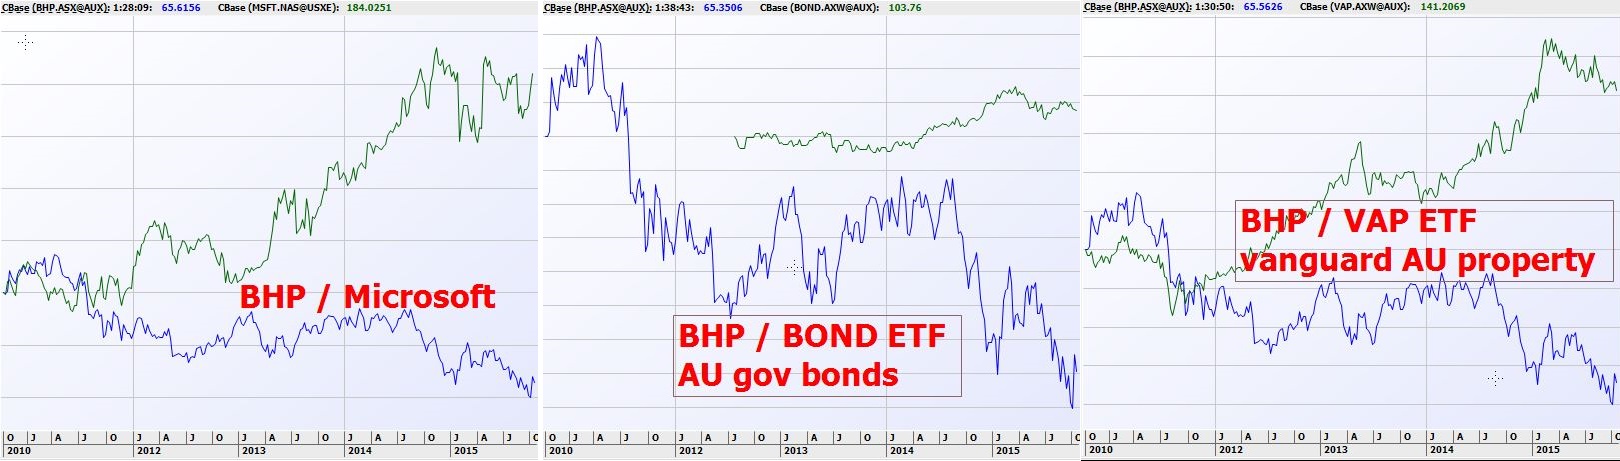
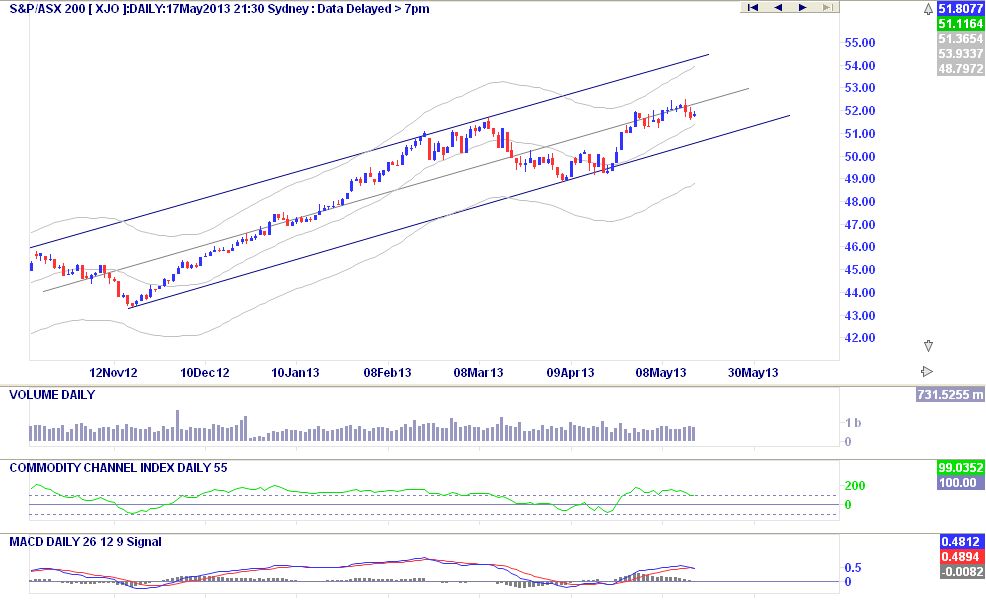
A lower correlation would occur between BHP and ANZ being from different market sectors, but still the same fate may be born if the Australian share market is struggling.

A lower still correlation may be obtained with BHP and Microsoft.

An even lower still correlation may be obtained with BHP and Government Bonds or BHP and Property. Both of which have an extremely low correlation of a similar move.

So why is this important? — The object of diversification is to create a robust investment strategy that will not collapse if the wind is blowing  the wrong way. The more assets you have in your investment portfolio that are moving in different directions the safer and more robust your investments will be. This doesn’t necessarily lead to a lower return, especially with the correct rotations and reweighting, but it does lead to safer investments.


bhp-diversify


Are you a Trader or an Investor ?

2015-10-06 16_02_54-photo share market investor - Google SearchOne thing that determines what strategies you need in the market, is whether you are a Trader or an Investor. They both have a goal of making money, but the means at which they approach things is completely different.

An investor should consider his long term goals and structuring investments to achieve those goals. An Investor could be using fundamental information to determine the current value compared to the target value the analysts have on the asset. They may be buying on the way down, in the hope that proper value will return to the asset creating a capital gain. Owning a good quality company which has been under performing is often the goal.  As an investor its important to look at asset allocation for diversification.

A trader will have a set of rules or triggers that cause him to act in the market. This may be very simple (like the crossing of a moving average) or very complicated with multiple rules and conditions. A trader will primarily be using Technical indicators to make decisions on the market.

As a Trader, your rules will determine the duration of your trades – with more aggressive rules, trades will be shorter in duration with faster entries and exits. With more conservative rules, entries and exits will be slower resulting in longer trade duration’s.

More aggressive conditions will trade more often, looking for smaller moves to take advantage of. More conservative conditions will trade less and require more evidence to enter (so will be slower). Its important to think that the speed of entry must match the speed of exit. Entering fast and not taking profit will lead to frustration, as will entering slowly and exiting fast. So entry and exit rules must be reasonably balanced. Think of a golf swing, a short back swing has a short follow through – a big back swing has a big follow through.

Traders and investors may also use different products to increase returns – options, warrants, CFD’s or futures increase gearing into investments as margin loans. As a rule of thumb, higher geared products are generally more suited towards traders than investors.

So which is right – that really depends on your mindset, your discipline, your confidence and your availability of information. Both traders and investors can be active in the market using very different strategies.

Whichever you are, make sure the strategies you use fit in with your goals.

Happy trading/investing 🙂

Week in Review


xjo31may

This week in the market saw only small sideways movements dropping 57 points over the 5 day period. Those reading last weeks technicals will notice that we are sitting on the low 4900’s decision point. We could see one of 2 things from the XJO this week – either the prices will fall through the 4900 level and head down towards the 4700 level or it could bounce off this support and head back towards the 5150 level. Either way, we may be in for a wild week. Continue reading “Week in Review”

Week in Review

MetaStock - [Chart2 - S&P AUST INDEX ASX 200 INDEX (Trade Price)]_2013-05-24_16-50-03

This week started out slow and steady, trading in a small range bound to the 5200 level. Wednesday had a close towards the low of its range and then things got a little crazy, closing at 4983 – a drop of nearly 4%.

Thursday and Friday saw the market drop 177 points driving the XJO chart through the rising trend line. At one point today the XJO was trading at 4954, but traded up in the last 90 minutes of the session.

From the chart right you can see that the market is approaching an intersection of 2 lines, a horizontal support line and a rising Fibonacci line, I would expect the XJO to pause and perhaps consolidate at this point. The chart should reach this zone quickly, perhaps Tuesday of next week. Continue reading “Week in Review”

Week in Review

xjo-17may

Another week trading within a very small range, we see the XJO trading sideways holding ground around the important 5200ish level.

Over the next week, look for small falls on the XJO down towards the rising trend line, this opinion is based on both the CCI and MACD which are just about to cross to the downside, we should see the market retesting the current trend at around the 5100 level.

This level is important as it will show how strong the overall market is, should the XJO bounce off the rising trend line, we could easily see the market rising towards the 5500 level within a few months. Failure at 5100 will see us fall quickly back towards the 4900 level.

A Shift from Financials Technically

The financial sector has led the charge over the last few months. In the last 2 weeks we have seen a noticeable drop off in strength, partly because of the dividend pressures in May. Nonetheless the MACD has signalled a move to the short side, with the CCI about to do the same. Notice the chart moving towards a triangle shape with the centre being support at the 5700ish level. Continue reading “Week in Review”

Superannuation

If you have ever wanted to take a little more control over your superannuation and not bother with a self managed superannuation fund this may be of interest.
of us that are/were self employed This could be quite valuable for those

without a lot of super, perhaps an smsf is too expensive or too time consuming – the AMG product may be just what the doctor ordered.

If  your super its just sitting in a dusty fund collecting the minimum – take a look.

Let me know if you would like to explore this


Options Writing on your portfolio

One of the things I love about options is that there is nearly a strategy for every market condition.

Rather than using the same strategy accross all conditions which may give you questionable results, tailer made strategies can be used to take advantage of current conditions. One strategy that has been adding a lot of value to shares inside an existing portfolio is Covered Written Calls.

Below is an image showing trades taken on an actual account over the last few months, prices noted are per share in cents. Each trade places cash back into the trading account, when the trade is taken. Brokerage is not considered in this diagram.

Now there is risk with any strategy, understanding how to manage that risk is the secret to being profiatble with any strategy.

So if your leaning towards the risk averse end and you would like to add some value to your return, you do have a few choices.

If you would like some examples or a couple of strategies that may suit your style, please give me a call on 0402 855 800 or shoot me an email to steve.soars@gmail.com