Oil as we all know has had dropped just under 75% over the last 7 quarters from $105 to $26usd per barrel, the issue is just oversupply and lower demand, pretty simple in economic terms. However this is creating another issue that’s about to get pretty interesting. If current production/usage rates continue, storage is about to become a pretty big issue with oil producers, which may force a critical turning point for the industry.
So the logical conclusion is that unless more storage is created around the globe for the surplus, producers will have to either cut production or to find additional storage which in the short term.
World Oil storage is sitting at around 96%. The large stores of oil currently would indicate 1 of 2 things – either; more storage facilities need to be created around the world to increase the current holdings of excess or the oil providing nations will need to engage tankers as a temporary overflow as they wait for a buyer. If the latter is the case then the very expensive floating storage costs will be borne by the supplier (rather than the purchaser which I assume is the case now). Now that is very black or white, but in reality they are the only choices.
I feel that the combination of oversupply, lower demand, the reduction in available storage, may be the critical point for the oil producers. Future production should lower in North America with the shale oil producers being squeezed out (or at least scaled back), though I’m not sure how much of a change in global supply that will create. One thing that’s pretty certain, is that there is too much oil, not enough buyers and a lack of additional storage.
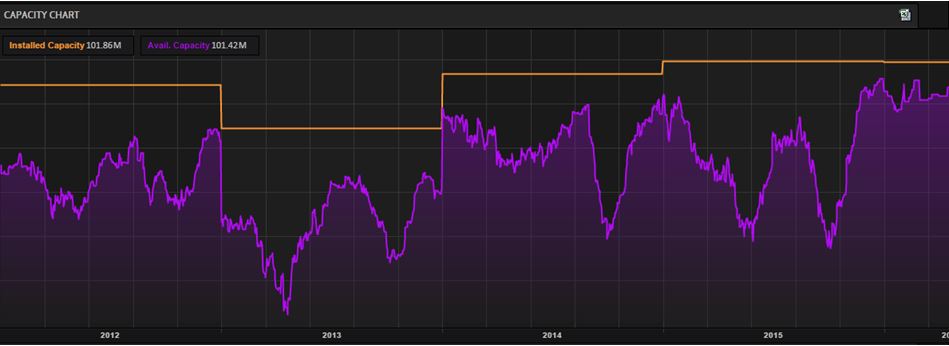
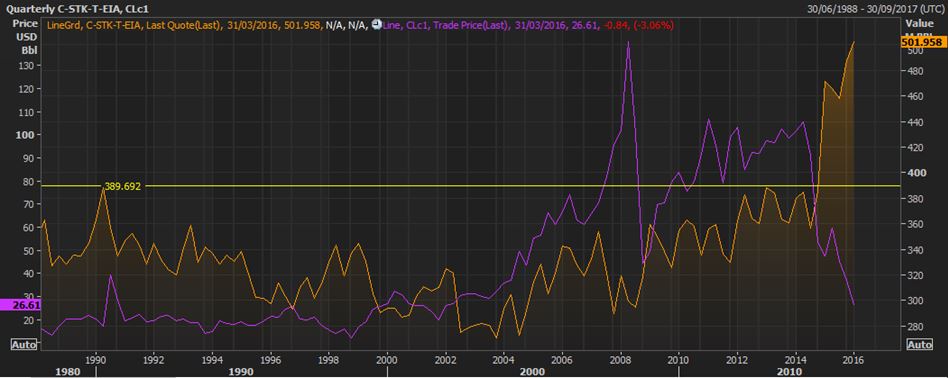
The chart above shows current holdings and storage capacity – currently they are running just under 96% capacity hence storage rates rising 10% since August, or 29% over the last 17 months. The chart below is the current storage costs in relation to the oil price. Considering the change in percentages in the last year between the commodity and the storage, this has got to be squeezing someone.
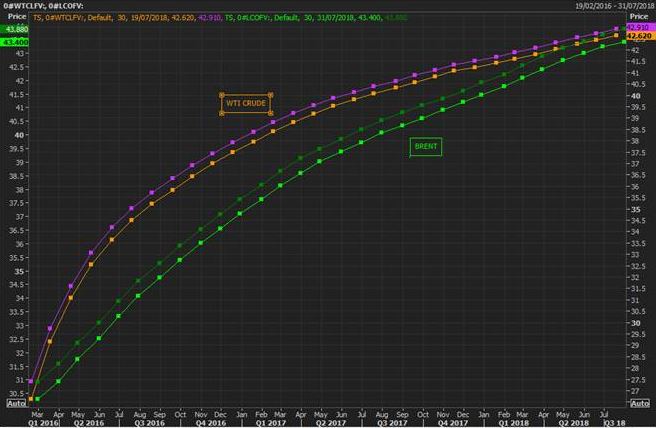
Looking at the forward futures charts from Thomson Reuters, based on known variables the TR computers have come up with the following forecast curves on oil prices over the next couple of years. This is fluid data and forecasts will change with given conditions. But any producer with a $40 barrel cost is in for a long period of pain, I’m not sure I could get long oil or gas with this data, until something changes. 
(Charts taken from Thompson Reuters Eikon 11Feb2016)
Happy investing


