Week in Review

MetaStock - [Chart2 - S&P AUST INDEX ASX 200 INDEX (Trade Price)]_2013-05-24_16-50-03

This week started out slow and steady, trading in a small range bound to the 5200 level. Wednesday had a close towards the low of its range and then things got a little crazy, closing at 4983 – a drop of nearly 4%.

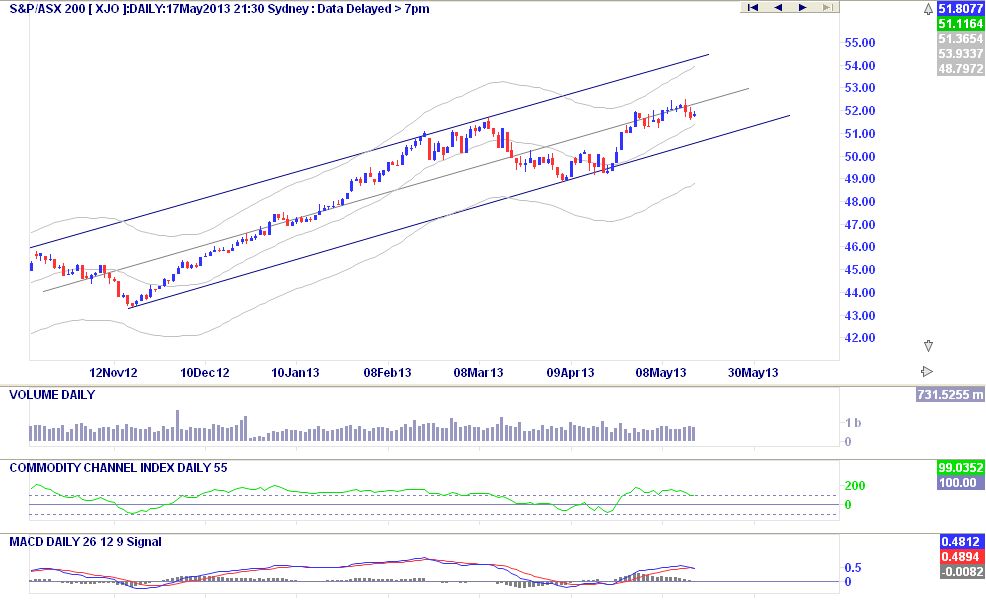
Thursday and Friday saw the market drop 177 points driving the XJO chart through the rising trend line. At one point today the XJO was trading at 4954, but traded up in the last 90 minutes of the session.

From the chart right you can see that the market is approaching an intersection of 2 lines, a horizontal support line and a rising Fibonacci line, I would expect the XJO to pause and perhaps consolidate at this point. The chart should reach this zone quickly, perhaps Tuesday of next week. Continue reading “Week in Review”

Week in Review

xjo-17may

Another week trading within a very small range, we see the XJO trading sideways holding ground around the important 5200ish level.

Over the next week, look for small falls on the XJO down towards the rising trend line, this opinion is based on both the CCI and MACD which are just about to cross to the downside, we should see the market retesting the current trend at around the 5100 level.

This level is important as it will show how strong the overall market is, should the XJO bounce off the rising trend line, we could easily see the market rising towards the 5500 level within a few months. Failure at 5100 will see us fall quickly back towards the 4900 level.

A Shift from Financials Technically

The financial sector has led the charge over the last few months. In the last 2 weeks we have seen a noticeable drop off in strength, partly because of the dividend pressures in May. Nonetheless the MACD has signalled a move to the short side, with the CCI about to do the same. Notice the chart moving towards a triangle shape with the centre being support at the 5700ish level. Continue reading “Week in Review”