Averaging Down

Sooner or later we all end up with a losing position on a good quality share, we may feel that we can ride out the slump and wait for the market to regain its former glory. One technique we can use to assist is to average down our purchase price. With this strategy we would purchase another parcel of shares at a lower value effectively lowering the average purchase price of the entire holding.

Lets say we own a parcel of 1000 shares has been purchased shares for $10.00, and the position is worth less than the original purchase – Say $6.00 per share.  Lets assume that no risk management has been applied (because if it was, you wouldn’t be in this position).  Buying another 1000 shares at $6.00 would lower the complete average on the asset to $8.00.

So lets look at the right time and the wrong time to do this. The wrong time is when the market is falling, if you are averaging down into a falling market is very difficult to achieve a good result, because we don’t know how far the price will fall. If the price falls to $3.00 your decision to average down hasnt been a good one. The ramifications of getting this wrong may impact on your positions profitability, it may create an imbalance in your portfolio or in the worst cases give you greater exposure to a dying asset.

A more appropriate time to use this strategy would be to wait for the market to form a support base and bounce – at least in this way the market is moving in your favour again. Try to look at it like entering the position again — does it meet my normal entry criteria, if so its the right time – if not then wait until it does, or forget this strategy.

Ideally averaging down with the market bouncing off a support line and forming a bullish pattern is the time to average down, the stronger the move upwards the more likely you will have a successful trade.

In Short: Don’t Average Down into a falling market, go when the market is rising. Getting this right will give you the ability to lower your original entry price so you may trade out of the position with a profit.

Happy Trading

Trading Channels

Markets will often move in repeating patterns or ranges, there are a number of different names for this but breaking away from the titles, our obligation as traders or investors is to make good choices in our investments.

As observers watching a market our best opportunities come when we identify repeatable conditions. Sometimes we see that the price action is moving between an upper range and a lower range, sometimes called a channel. As a trader this offers some nice trading options, the biggest being a repeatable opportunity trading into the active “leg”.

A couple of things to consider when analysing a channeling trade;

  1. Trade with the dominant channel direction – One of the most viable principles in trading is to follow the more dominant direction. This is because the dominant direction will be more profitable. Of course it is possible to trade against this direction, though more care should be taken as it would be considered a higher risk trade. When channels are flat in direction profitable trades may exist in both directions.
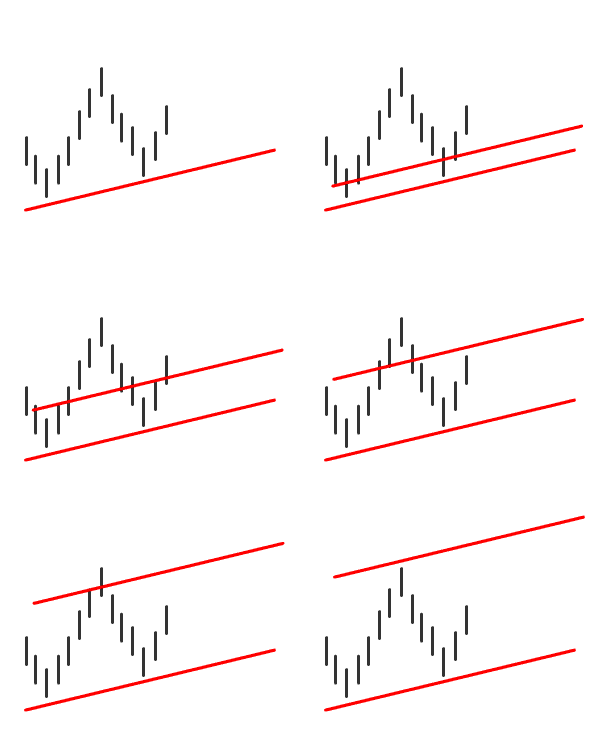
  2. Connect your peaks or troughs – This is to gain an understanding of when the market is reaching the extremities of the trading ranges. Normally the channel is identified by connecting either a couple of troughs or peaks. Duplicate the first line and move it to the other side, often this can be done before the 4th leg has started. (see top image). Once the second peak is in place further adjust the angles of your lines.
  3. Larger channels take longer to reach the extremities, but provide you with a bigger return, smaller channels are faster and more frequent.
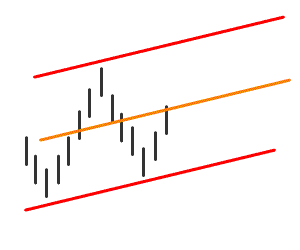
  4. Plot a mid point – The mid point of the channel will often cause the price to pause, stutter, stall or even reverse. This is more important on larger channels, but as valid on smaller ones.

In very simplistic terms – Buy at the bottom, Sell at the top and stay out of the middle. Now that’s about as generic as I can be, your trading rules should be a little more thorough.

From a reality perspective we will never trade the complete width of the channel, you will loose a little on each side. So determining whether or not a channel trade is viable is an easy choice – how far is it (in $) from the channel lines? This is the potential profit on the trade. When you shave from both sides, is there enough room for you to get in and out and make a buck?

Channels can be some of the best opportunities we have as traders, so do 2 things. Firstly, watch your channel regularly, identify the movements and speed – be  ready for the next move. And second, tell me about it 🙂

Happy trading

Transition to Retirement

In recent weeks I have been training to keep my accreditation current, during this I stumbled upon a little gem that may suit your situation.

It deals with retirement and Self Managed Superannuation Funds (SMSF). Once you arrive at the “preservation age” (currently 55 years, if you were born before 1960) you have the ability to look at the “Transition to Retirement” options.

Now a number of rules apply here, so its best to see a financial advisor to get information pertaining to your specific situation, but let me outline some of the options.

Although the transition to retirement rules were originally introduced to provide for people over the  preservation age to move into part time work, they can also be used to allow those people to continue in full time work and start to take advantage from your hard earned superannuation.

So what are the benefits? From 55 years, you may start to take a pension from your SMSF between 2% and 10% per year of the balance – but before you say anything let me continue.

Tax on your SMSF occurs at 15% until you start a retirement income stream (pension), from then on it is tax free. Im sure most of you have heard of Salary Sacrifice – basically your  employer pays money into your SMSF to give you added tax benefits with a current limit of $50,000 (if you are under  50 its only $25,000 p.a.), this comes from pre-tax income so the benefits are greater .

So lets look at some numbers considering things like Salary Sacrifice in the equation.


In the above table “Sally” takes a $41,000 salary sacrifice to be added into super and deduct $33,000 pension from the SMSF. Using the above figures, Net income is the same but the super fund grows at $7,000 p.a. faster – not a bad trade off.

Gold, A sparkle of hope.

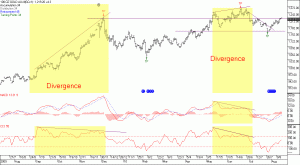
With uncertainty in equity markets around the world, one of the places smart money is rushing towards is Gold. Looking at the chart, over the past 18 months has shown us some great examples of “Divergence”. Where we can see charts continuing to make higher peaks and troughs but momentum indicators like “MACD” and “CCI” show an opposite direction.

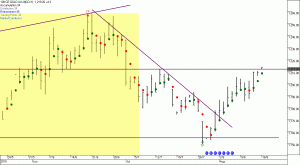
At this point in time gold is testing the resistance coming from the peak of December 09. Momentum indicators are showing strength and using the Market Conductor (below) we are seeing very positive signs of continued growth.

If you are in the market for the next area of growth, maybe the gold sectors are worth a look. Oh, and don’t tell your wife that gold is a great opportunity, or else you may find yourself on the way to the local Jewelery Store to fulfill her requests.

The trend is your friend?

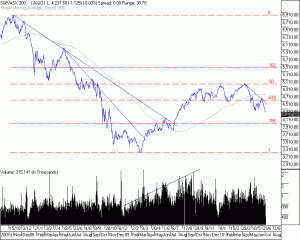
Governments around the world did a fairly good job injecting funds into schemes to “kick start” their economies from the lows of early 2009. Eighteen months later we have seen a 50% retracement from the “Bear Market” through 08, with markets gaining ground nicely.

The steam started to come out of the market late 2009, transitioning from a nice bullish pattern into a sideways channeling movement. During this phase we started to see the hangover of the short 09 bullish surge.

Once the AXJO dropped below support at the 4500ish level in May 2010, the market shifted into a downward trend once more.

One of the biggest sayings in trading is “Trade with the trend – The trend is your friend”, the way we identify longer term trend changes is using the peaks and trough positions on the chart.

With that information, we must identify we are again with the Bears. So what do we do with longer term portfolios?

Three choices exist;

  1. Let it run, over the longer term the market will fight its way back to previous levels – provided the shares within your portfolio are sound.
  2. Exit your positions – bank your profits or cut your losses.
  3. Take an opposing positions to offset losses. This is called hedging.

Whatever you choose, make sure you take into consideration all the “pros and cons”.

The trend is your friend? Only if you recognise it and act accordingly.

Happy Trading

Troubling Times

Firstly my thoughts go to all those effected by poor financial practices of Storm Financial, Opes Prime and of recent days Sonray Capital Markets. It is beyond my scope to accuse individuals without all the facts but the question remain, how could this happen?

All three seemed to have different investment models, but one common thread persists, they all failed to protect their clients from loss. With any investment there is risk, and as investors we should accept that. The higher the potential return the higher the potential losses, disastrous outcomes arise when leverage is used to out-gear the asset base without the proper protection.

I’m not entirely familiar with storm, but reports suggest the strategies they implemented was to get clients to increase debt on assets to give them more resources to invest, thus increasing fees. This was done to a level where some clients had no possibility of covering fees when the investments turned bad.

For opes prime, clients were encouraged to take out equity financing arrangements to buy shares, typically in companies in the highly speculative mining and technology sectors.

Unlike traditional margin lenders, who typically only lend money against blue chip or heavily traded stocks, Opes Prime arranged for its clients to borrow to invest in companies outside the S&P/ASX 300 Index. Some of the companies had market capitalisations of less than $200 million.

In return, Opes Prime required clients to hand over control of their entire portfolios, regardless of the degree of leverage.

Sonray also used a common asset base, within client segregated trust accounts. Their model allowed for a 60% margin lending facility on top 200 shares, whether or not the clients used this facility. This margin was able to be used on electronic products, namely CFD’s and Forex – each using high leverage.

So for a $10 asset, 60% margin loaned gives the client $6. The $6 loan could be used to leverage into $60 of CFD’s or $500 of forex. This model is fine when trades are on the right side of the market or use an appropriate risk management strategy, but things go horribly wrong when traders are on the wrong side of the market – creating both a shrinking asset in the share plus leveraged losses on the cfd or forex position.

Recent news indicates a “rogue trader” was the issue with Sonray. It is unclear whether the trader was in the employment of Sonray, but I would suggest it was, that would be the only way to hide the damage for so long. My assumption is that trades went bad inside discretionary accounts and rather than take the loss and potentially loose the client they tried to trade out of it, getting further and further into a hole.

I feel sorry for the hard working people who have lost genuine assets due to the incompetence of others, losers also include staff at these firms and their families, most I am sure were unaware of any impropriety.

Most casualties are the innocent.

References:
http://www.theaustralian.com.au
http://www.abc.net.au/