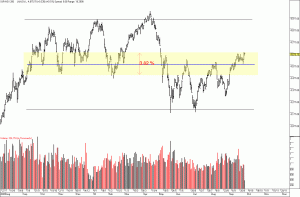
In the last 13 months the AXJO has been trading sideways, I’m sure not a surprise to anyone. Those trading this period have been consistently scratching their heads about future direction – even professional traders have had troubles.
 Looking at the chart (right) we can see the extended range between the peaks and troughs of the last year spanning around 800 points – take a mid point to that around 4580 and notice that within a small range how many times the market has changed direction.
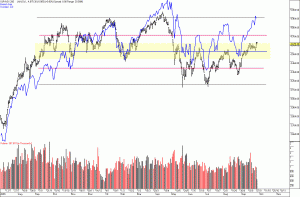
During the last year we have been bombarded with tiny wins and losses from not only on our shores but from around the world – most of which should have no bearing on our market but alas they have. When we overlay the DJI onto the AXJO (below) we can see that the US market is acting a little bit more stable than ours. I have also added additional 1/2 markers from the mid point to the extremities which have also acted as support/resistance points.
This direct comparison surprised me a little considering the constant bombardment of “how strong our economy is”, and “how unstable the US is”. On the other hand it also shows us that there may be better opportunities in Australia than in the USA.
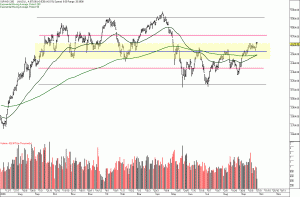
From the chart right, we are seeing the 50 day moving average now start to cross the 200 day moving average, this has always been a good sign for trend traders, lets hope our index can break out of this tight range and forge some solid gains over the next few months.
Happy Trading


